Reports and Insights
Insights enables users to quickly analyze data visually and as reports. Customize by Trade Partner, Product, Dates, Shipment Types and more.
Step ONE: Customize the Data
- Go to Insights
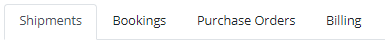
- Select from the following parent tabs:
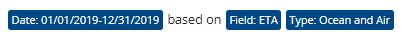
- Select filters, such as:
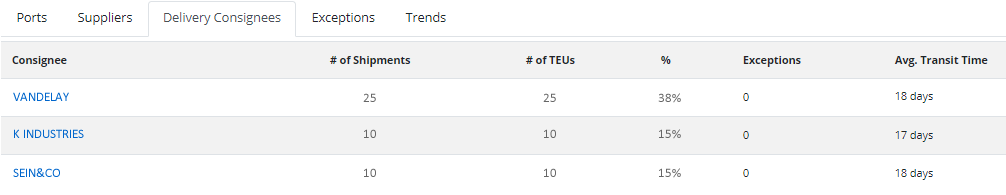
- Select from sub-tabs, such as:

Step TWO: Review the Data
A couple ways to digest the data:
High level: Header icons showing cumulative data, such as:
![]()
Detailed level: The table shows top results, such as:
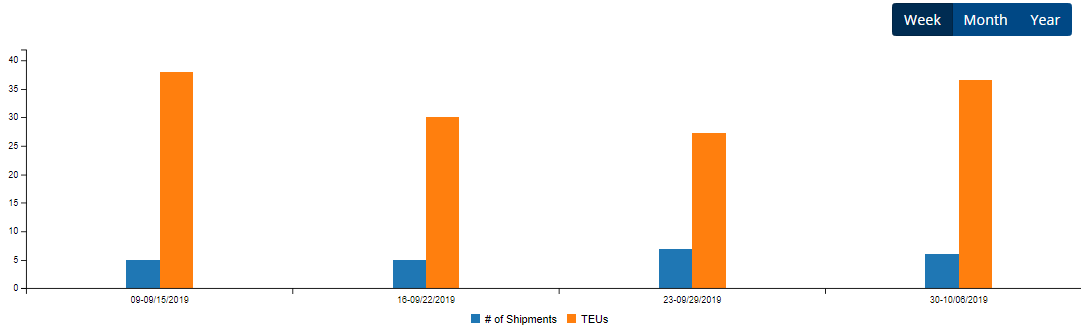
Step THREE: Review Trends
Click ![]() to see how numbers compare week to week, month to month or year to year:
to see how numbers compare week to week, month to month or year to year:
Additional tips:
- Excel Reports can also be generated elsewhere throughout Cargocentric. Look for the
 button.
 - Visit the Dashboard for a quick glance how your supply chain is performing.